Updated: June 11, 2026
|
10 min read
Updated: June 11, 2026
|
10 min read
Pop Traffic CPM Rates 2026: GEO Benchmarks, Bids, and Budgeting
Most buyers don’t lose money on pop because the GEO was wrong. They lose it because the CPM number came from a different auction reality than the one they actually bought. That’s why pop traffic CPM rate charts are essential in any pop ad platform. only make sense when you normalize for device mix, quality filters, and whether the number is a floor or a blended clearing average.
But before diving into pop traffic CPM benchmarks, learn six terms that anchor everything below:
1. Quote — the headline number a vendor names upfront. It’s a provisional ask, not a settled price, and serves as your starting point before adjustments.
2. CPM (cost per mille) — the price per 1,000 impressions, and the core buying model for pop traffic. Formula: budget ÷ CPM × 1,000 = impressions.
3. Clearing rate — what filtered traffic actually buys at once quality is accounted for. The gap between the quote and the clearing rate is the whole point of the article.
4. Floor vs. clearing average — the floor is the cheapest visible price (often junk traffic); the clearing average reflects where filtered inventory genuinely lands. Two numbers for the same country can describe completely different inventory.
5. GEO tier — countries sorted by traffic cost and value. Tier-1 (US, UK, Germany, Canada, Australia) sets the ceiling; Tier-2 (Brazil, Mexico, Indonesia) sits mid-range.
6. Quality filters / anti-fraud — carrier, OS, and browser targeting, bot filtering, and fresh inventory. These push a clean quote 40–200% above an unfiltered one.
7. Direct vs. brokered inventory — a publisher-direct feed versus resold run-of-network supply. A brokered quote can look half the price and still be the worse buy.
Methodology for comparing pop traffic CPM quotes in 2026
A $0.50 quote and a $2.50 quote for the same GEO often describe different inventory, not a pricing error. Compare pop CPMs only after you lock five variables: reporting basis, device split, quality filters, source type, and freshness window.
Use this order to compare CPMs when choosing between ad networks:

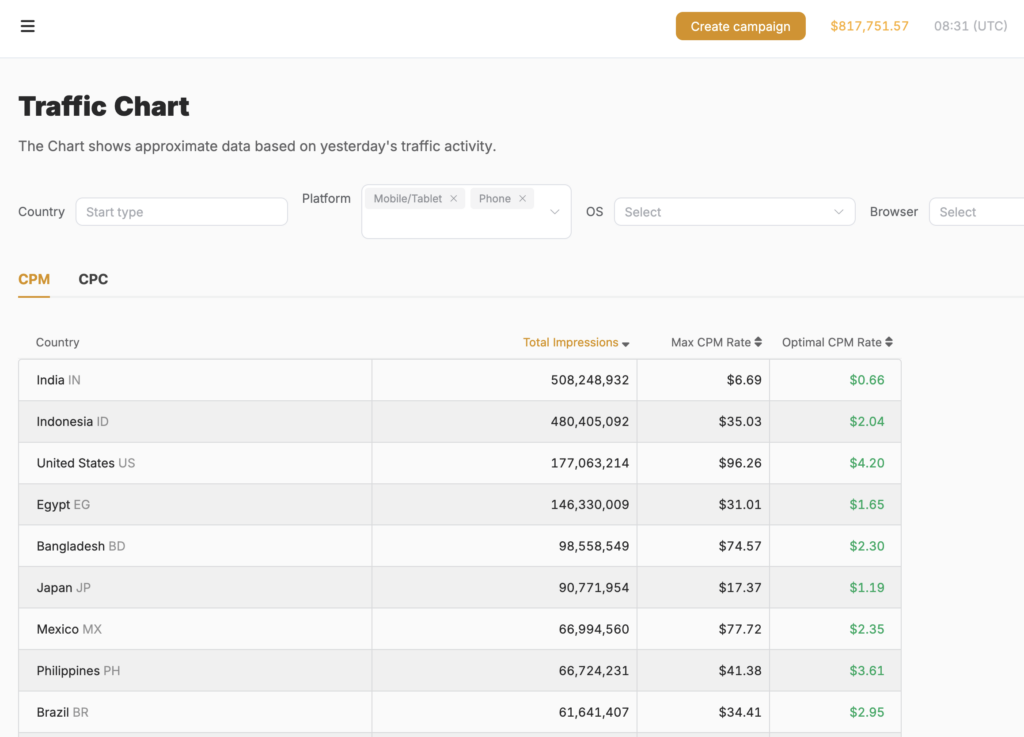
One useful reference here is the Remoby Traffic Chart, available online and in the advertiser’s account; it reflects blended clearing levels, not the cheapest visible floor.
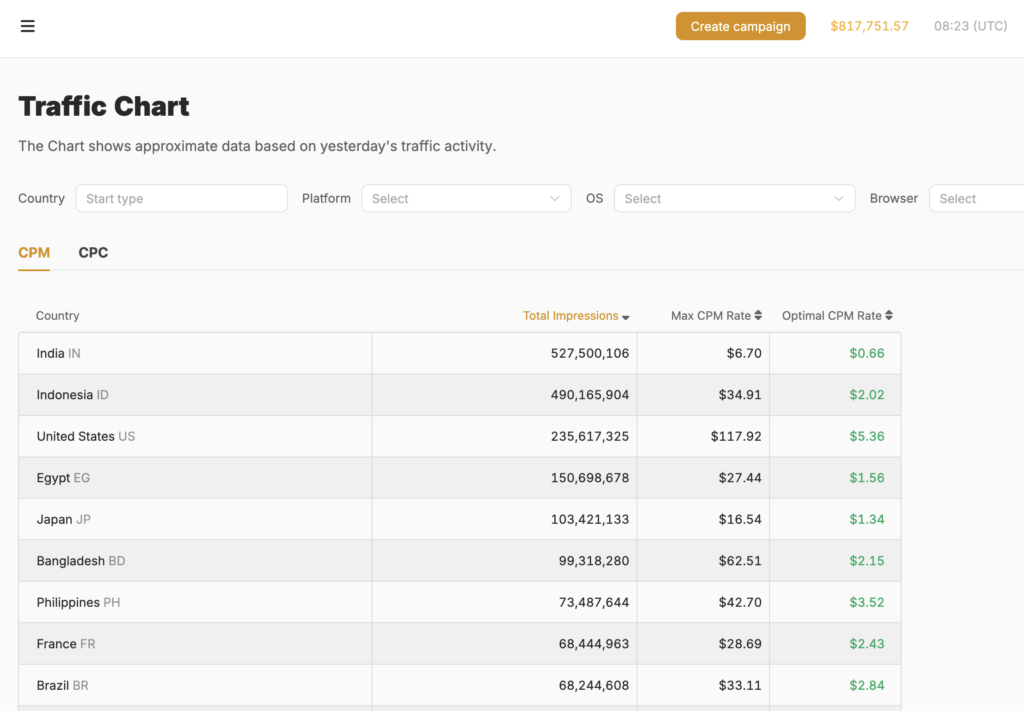
A cheap floor tells you where traffic starts. A usable benchmark tells you where filtered traffic actually clears. The harder part starts when the quote looks comparable on paper, but the feed quality still isn’t.
2026 pop traffic CPM benchmarks by GEO tier and key countries
Tier-1 pop traffic CPM rates in 2026 usually clear around $3.00–$6.00+ depending on device and filters, not at the rock-bottom floor. Remoby Traffic Chart averages show US at $5.36, UK at $4.57, Germany at $3.85, Canada at $4.59, and Australia at $5.87. Business of Apps, a portal for marketers, also places Tier-1 pop ranges around $3–$5 as a broad market reference.
Example: a filtered US mobile campaign can buy at the low end of Tier-1, while desktop often clears above $5.
| GEO / Tier | Blended 2026 CPM | Notes |
|---|---|---|
| US | $5.36 | Tier-1, filtered traffic average |
| UK | $4.57 | Tier-1, strong mobile competition |
| Germany | $3.85 | Tier-1, slightly lower blended clearing price |
| Canada | $4.59 | Tier-1, broadly comparable to UK inventory |
| Australia | $5.87 | Tier-1, premium traffic and auction pressure |
| Brazil | $2.84 | Tier-2, established benchmark for quality traffic |
| Mexico | $2.28 | Tier-2, common entry point for testing |
| Indonesia | $2.02 | Tier-2, broad mobile inventory availability |
| Vietnam | $1.55 | Tier 2, lower average auction clearing levels |
| Thailand | $3.99 | Tier 2, quality inventory commands higher bids |
| Philippines | $3.52 | Tier 2, competitive segments drive CPM upward |
| India | $0.66 | Reference floor level; not representative of premium traffic |
| Verdict | Tier-1 commonly clears in the $4–6 CPM range, while Tier-2 spans roughly $1.5–4 CPM depending on competition and filtering | Always compare CPM together with conversion quality, approval rate, and ROI—not as a standalone metric |
The source of this table is Remoby Traffic Chart.
The country rows help, but device splits (mobile vs desktop traffic) change the buy more than most benchmark tables admit.
Ready to launch with Remoby?
Are mobile pop traffic CPMs usually higher than desktop in 2026?
Mobile pop traffic CPMs in 2026 depend on GEOs, but are most of the time lower than desktop in absolute Tier-1 averages, but mobile competition pushes filtered segments up fast. Expert benchmark ranges put Tier-1 mobile around $3–$4, while Tier-1 desktop often clears at $5–$6+.
Example: US desktop pop often needs a higher source bid than US Android mobile, even when mobile gets more volume.
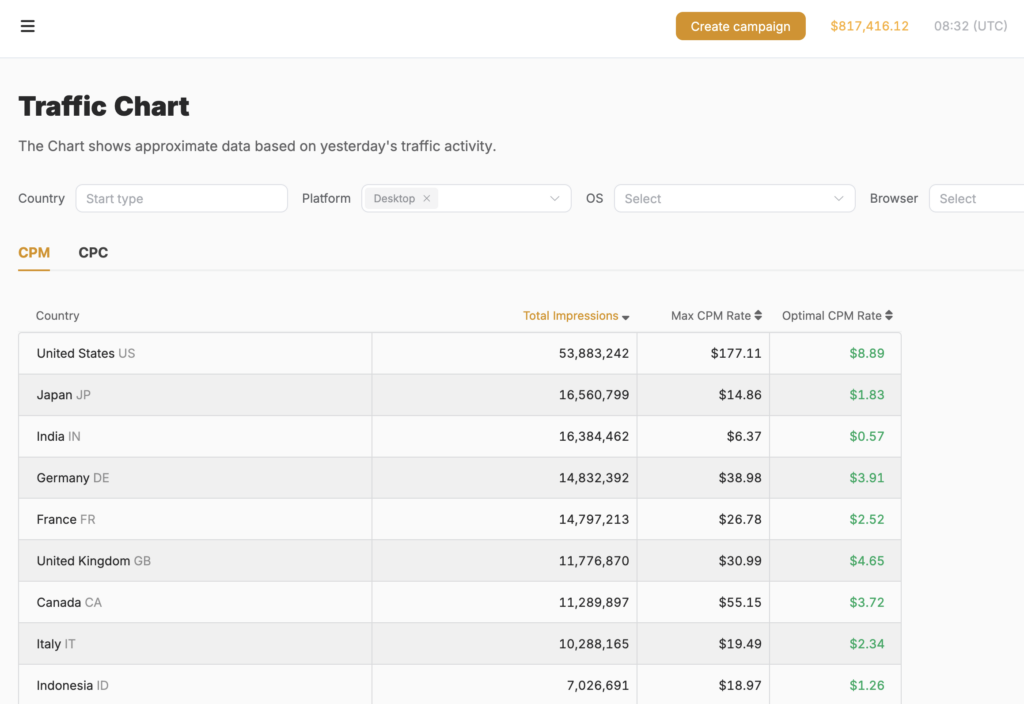
That sounds backward if you focus only on advertiser demand. Inventory structure explains it. Desktop pop still concentrates a lot of premium placements in a smaller pool, while mobile volume spreads wider across feed quality. Once you narrow mobile by carrier, browser, or OS version, the gap shrinks fast.
If you run broad run-of-network mobile, you can still buy cheaper. If you run filtered mobile for iGaming or Finance funnels, you stop buying “mobile” and start buying a premium slice of mobile. That slice is where older device-wide assumptions stop helping.
Quality-adjusted pricing vs cheap unfiltered inventory
Quality-adjusted pop CPM benchmarks in 2026 should usually sit 40–100% above an unfiltered quote, and heavy junk cleanup can push the increase to 100–200%. Expert campaign data shows a $0.50–$1.00 Tier-2 quote often describes floor traffic, while clean Brazil, Mexico, or Indonesia traffic clears closer to the $2–$3 chart band.
Example: adding carrier targeting, bot filtering, and fresh inventory can move a $1.20 quote to $2.40 or more.
This is where buyers underbid themselves. They see a low quoted CPM, match it, and then wonder why the only zones they win already sit on everyone else’s blacklist (and no, that pattern doesn’t appear in any network’s onboarding doc).
The cheap number buys volume. The average band buys traffic that has a chance to convert. If your funnel bundle needs stable LP CTR and postback signal, pay attention to advertiser feed quality before you celebrate the floor.
I once spent two days debugging a postback mismatch on a pop campaign that looked “cheap.” The tracker was fine. The problem sat upstream: the bid was too low, so the campaign only won dead zones. One bid change fixed more than the tracking audit did.
Once you price quality correctly, the next question is whether the extra CPM actually buys better inventory or only narrower inventory.
Low-cost vs stricter-quality filter comparison table
Most buyers learn the floor-vs-average lesson after they burn a test budget on zones nobody wanted. The table below maps what each buying posture actually delivers — price position, traffic character, and what it means for your first decision cycle.
| Setup | Typical CPM position | What you usually get | Practical verdict |
[IMAGE: COMPARISON | Table contrasting unfiltered floor traffic with average-band and strict-filter pop inventory by price, volume, and test readability.]
Cheap traffic fails fast. Comparable traffic fails slower, but it teaches you something useful.
What affects pop traffic CPM rates in 2026 the most?
Pop traffic CPM rates in 2026 move most on GEO tier, inventory source type, quality filters, device mix, and reporting basis. GEO still sets the ceiling, but floor-vs-average reporting and direct-vs-brokered supply create the biggest quote distortions.
Example: a brokered mobile Mexico quote with no anti-fraud controls can look half the price of a direct filtered Mexico feed and still be the worse buy.
Seasonality still matters, especially in Q4, but it usually amplifies the existing order rather than changing it. US, UK, CA, and AU stay expensive. India stays a low-floor reference. Tier-2 absolute averages stayed flatter from 2024 to 2026, while effective CPM for clean inventory rose because anti-fraud filtering became standard.
Reporting basis sounds administrative until it changes your launch bid by 2x.
Why can two sources quote very different pop traffic CPM rates for the same GEO in 2026?
Different pop traffic CPM quotes for the same GEO usually come from three mismatches: one source reports a floor, another reports a blended auction average, and each source applies different inventory and filter assumptions. Device mix also distorts the comparison.
Example: a $0.90 Indonesia quote can describe unfiltered Android floor traffic, while a $2.02 benchmark reflects cleaner blended traffic that actually clears.
This explains why network screenshots often look contradictory when they are not. Remoby can show broad market ranges, PropellerAds can show floor logic tied to platform bidding, and others can show average clearing levels. Same country, same day, different measurement object.
If the quote gap still looks suspicious after that, you need a comparability checklist, not a better guess.
If one network shows a much lower pop CPM for the same country, how do you check whether the traffic is actually comparable?
Traffic comparability for a lower pop CPM quote depends on matching the buying conditions before you compare price. Check reporting basis, device share, filter stack, source type, and placement depth.
Example: a cheap Thailand quote loses meaning if it includes deeper-session inventory, mixed desktop/mobile, and no bot filtering while the higher quote excludes all three.
Use a quick operator checklist:
- Match country, device, and OS split.
- Match anti-fraud, freshness, and carrier/browser restrictions.
- Ask whether the number reflects floor, average, or top CPM.
- Check if the source is direct, brokered, or mixed.
- Run equal test budgets and compare whitelist yield, not raw spend.
Comparable traffic reveals itself in zone-level survival, not in the first screenshot. And once you trust the benchmark, you can finally set a launch bid that isn’t blind.
How should advertisers use 2026 pop traffic CPM benchmarks to set starting bids by GEO?
Starting bids from 2026 pop traffic CPM benchmarks work best when advertisers open at 1.1–1.2x the GEO’s blended average, then cut waste back toward that average with blacklist and whitelist work. Bidding below the average usually wins only low-priority zones. Example: if Brazil averages $2.84, opening around $3.10–$3.40 gives cleaner volume than trying to start at $1.50.
That rule matters more than the exact decimal. You are not trying to buy the whole GEO on day one. You are trying to get enough readable traffic to identify zones worth keeping, then trim source bid and placement access with data from Voluum, Binom, RedTrack, or Keitaro.
Launch bid solved one problem. Budget sizing, especially when scaling iGaming apps, decides whether the test tells you anything.
A simple way to turn pop traffic CPM benchmarks into a starting test budget for one GEO
Test budget from a pop traffic CPM benchmark should cover enough data to judge the funnel, not just enough impressions to spend something. A workable rule is 30–50 conversions at target CPL, which often lands around $300–$500 in a $2–$3 Tier-2 GEO. Example: Brazil at roughly $2.84 CPM needs a few hundred dollars to produce readable zone-level patterns, while India at $0.66 needs less.
Use this workflow:
- Pick one GEO and one device mix only.
- Set your launch bid at 1.1–1.2x the benchmark average.
- Estimate impressions from budget: budget ÷ CPM × 1,000.
- Check whether that impression count can plausibly produce 30–50 conversions at your funnel CR.
- Run three days before sweep-clean decisions unless fraud or burn forces faster cuts.
Readable test budgets buy decisions, not hope.
What changed in 2026 versus older pop traffic rate assumptions
Most old pop rate tables underprice filtered mobile and overstate how much useful traffic sits near the floor. Tier 1 blended averages rose about 15–25% from 2024 to 2026 for filtered inventory, according to expert campaign observations, while desktop softened slightly as volume shifted to mobile.
Tier 2 looks flatter if you only read raw floor numbers. Clean traffic tells a different story. Anti-fraud moved from optional to default in many buying setups, so effective CPM on usable inventory climbed even when the headline average didn’t move much.
That shift explains why CPM still stays the buying model of choice for pop, even when affiliates optimize to CPL or CPA downstream.
Why buyers still use CPM for pop traffic
If you wait for CPA-style certainty before buying pop, you lose access to the auction. Pop clears on distribution and speed, so buyers still use CPM because it lets them control source bid, volume cap, and reach before the funnel proves itself.
The real control sits after the buy: blacklist bad zones, whitelist survivors, split by device, then judge EPC and CR at placement level. Networks like PropellerAds, PopAds, Adsterra, Clickadu, HilltopAds, and Galaksion all push you toward that workflow because pop inventory behaves like an auctioned traffic layer first and a conversion source second.
The system never promised a cheap benchmark would equal a useful benchmark. The useful one was the right one all along.
Ready to launch with Remoby?
FAQ for pop traffic CPM rates in 2026
Low Tier-2 pop quotes are not always bad, but they usually describe floor inventory. Treat them as mapping traffic, not as a reliable benchmark for filtered volume.
Device-specific benchmarks work better because desktop and mobile clear at different levels, especially in Tier-1. Mixing them hides the real bid floor.
Test duration should usually cover three days unless fraud, broken postback flow, or extreme burn forces faster action. One day often shows noise, not pattern.
Floor bids work when you only want cheap mapping volume. They usually fail when you need converting zones and a fast whitelist.