
Pop Ads CPM in India [2026]
What Indian pop and popunder traffic actually costs, broken down by OS, with the volume sitting behind each rate. Figures come from our own network.
Indian pop and popunder traffic is sold per thousand impressions, and it’s the cheapest inventory we have: the optimal CPM runs from $0.66 to $0.78 across our pop and popunder inventory, against $4.66 in the US. These are buy-side rates — what an advertiser bids to win the impression, not what a publisher earns from it. About 1.21 billion impressions are available a day — more than any other market we sell — and 96% of that is mobile, nearly all of it Android. What’s unusual here is how little the rates differ between segments. The rest of this page explains why that changes how you buy.
Important: check live data for all GEOs on the Traffic Chart page.
The durable picture (holds as rates move)
India is the volume market. About 1.21 billion pop impressions a day, roughly 43% of everything we sell across the five countries we publish. If you need scale, this is where it is.
The rates are nearly flat. From $0.66 on macOS to $0.78 on Windows — a 1.18× spread, the narrowest of any market we track. Segment-level bidding is the main lever in most countries. Here it barely moves the needle.
Android is effectively the whole market. It holds about 90% of available impressions, and at $0.72 it’s cheaper than iOS at $0.76. Desktop together is under 4%. There isn’t really a second segment to plan around.
Current snapshot — optimal CPM by segment
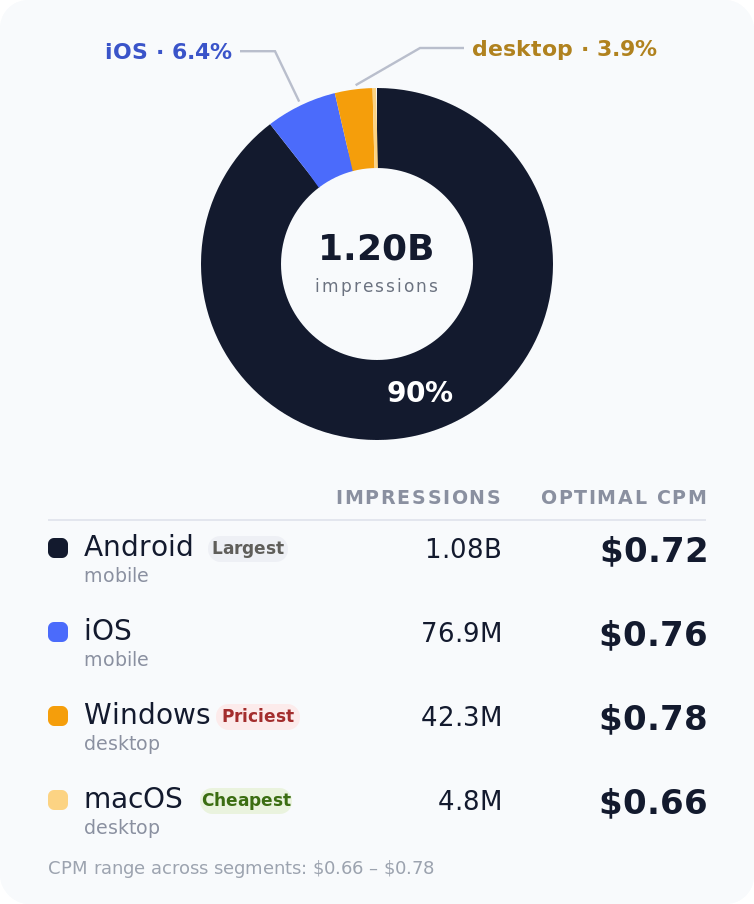
| Segment | Impressions available | Optimal CPM |
|---|---|---|
| Mobile · Android | ~1,077.9M | $0.72 |
| Mobile · iOS | ~76.9M | $0.76 |
| Desktop · Windows | ~42.3M | $0.78 |
| Desktop · macOS Cheapest | ~4.8M | $0.66 |
Rates change daily. The table is one day’s snapshot. For today’s numbers by country, OS and browser, use the free Remoby CPM & volume checker →
What drives India pop CPM
Optimal CPM isn't a rate card. It's what it currently takes to win a competitive share of a segment — and in India that number is close to the same wherever you look.
Operating system:
Barely matters here, which is worth saying plainly because it’s the opposite of most markets. The gap between the cheapest and priciest OS is 12 cents: $0.66 on macOS, $0.78 on Windows. Compare that to the US, where Windows costs 1.78× macOS. Bidding Android separately from iOS in India will not save you a meaningful amount.
Targeting depth:
Still applies. Narrow the pool and the price goes up, same as anywhere. But since 90% of the inventory is a single OS, the filters that actually change your cost here are the ones below OS level — zone, browser, connection type.
What this means in practice. The average across all Indian pop inventory is about $0.73, and every segment sits within 11% of it. So the money you’d save in the US by splitting bids, you don’t save here. What you spend your time on instead is traffic quality: at these prices the volume is easy to buy and the difficulty moves downstream, into which zones actually convert.
Pop vs Engagement Ads in India
Two different pricing units — the rates below are not directly comparable.
Pop / onclick Ads
Engagement Ads
The two rates aren’t comparable as written. Pop is priced per impression, engagement per click, and a pop impression already puts the user on your page while an engagement click is something they chose to do. To compare them properly you need a shared downstream number: cost per landing page visit, or cost per conversion.
India is our biggest market in both formats. It’s about 43% of our pop volume across these five countries and 48% of engagement volume, and at $0.0018 per click it’s the cheapest engagement inventory we have — roughly 4.7× under the US rate. If you’re testing engagement anywhere, this is the cheapest place to learn what it does for your offer.
How to use this
Pop Ads CPM in Other Markets
Ready to buy Indian pop traffic?
FAQ
Between $0.66 and $0.78 CPM, depending on OS, with the average across all Indian pop inventory at about $0.73. It’s the cheapest inventory we sell — roughly 6.4× under the US. These move daily; the live checker has today’s numbers.
Mobile, almost entirely. Android and iOS together are about 96% of available Indian pop impressions, and Android alone holds roughly 90%. Desktop is under 4%.
Usually not worth it. The gap between the cheapest and priciest segment is 12 cents — $0.66 on macOS against $0.78 on Windows, a 1.18× spread. In markets like Mexico that spread is 4.2× and splitting bids matters a lot. In India you can start on a blended rate and spend the effort on zone filtering instead.
Lower advertiser competition per impression, and a lot more inventory. India has about 1.21 billion pop impressions a day against 302 million in the US, so supply is roughly four times larger while demand per impression is much lower. The result is $0.73 against $4.66.
macOS desktop is technically the lowest at about $0.66, but it’s 0.4% of Indian inventory — under 5 million impressions a day, which won’t carry a campaign. In practice Android at $0.72 is both the cheapest segment with real volume and 90% of the market.
It’s the bid we’d recommend to win a reasonable share of a segment without overpaying. Better starting point than guessing or bidding the ceiling, and we calculate it per segment rather than one number for the whole country.
No. Optimal CPM is what an advertiser bids to win an impression. A publisher’s revenue is a share of the winning bid, so the payout side runs lower and depends on the placement.
Methodology. Aggregated from Remoby’s publisher network, pop/onclick inventory only. “Impressions available” is daily inventory in the segment; “Optimal CPM” is the recommended competitive bid. Other operating systems account for a small share of Indian volume. Segment figures are snapshots taken at slightly different points in the day, so they may not sum exactly to the country total. Figures are from 27 July 2026 and fluctuate daily — the CPM checker is always current. Segment: India · Pop ads · all verticals.