Updated: August 25, 2026
|
9 min read
Updated: August 25, 2026
|
9 min read
Advertising Metrics for Pop Ad Campaigns: How to Read Them as Decisions

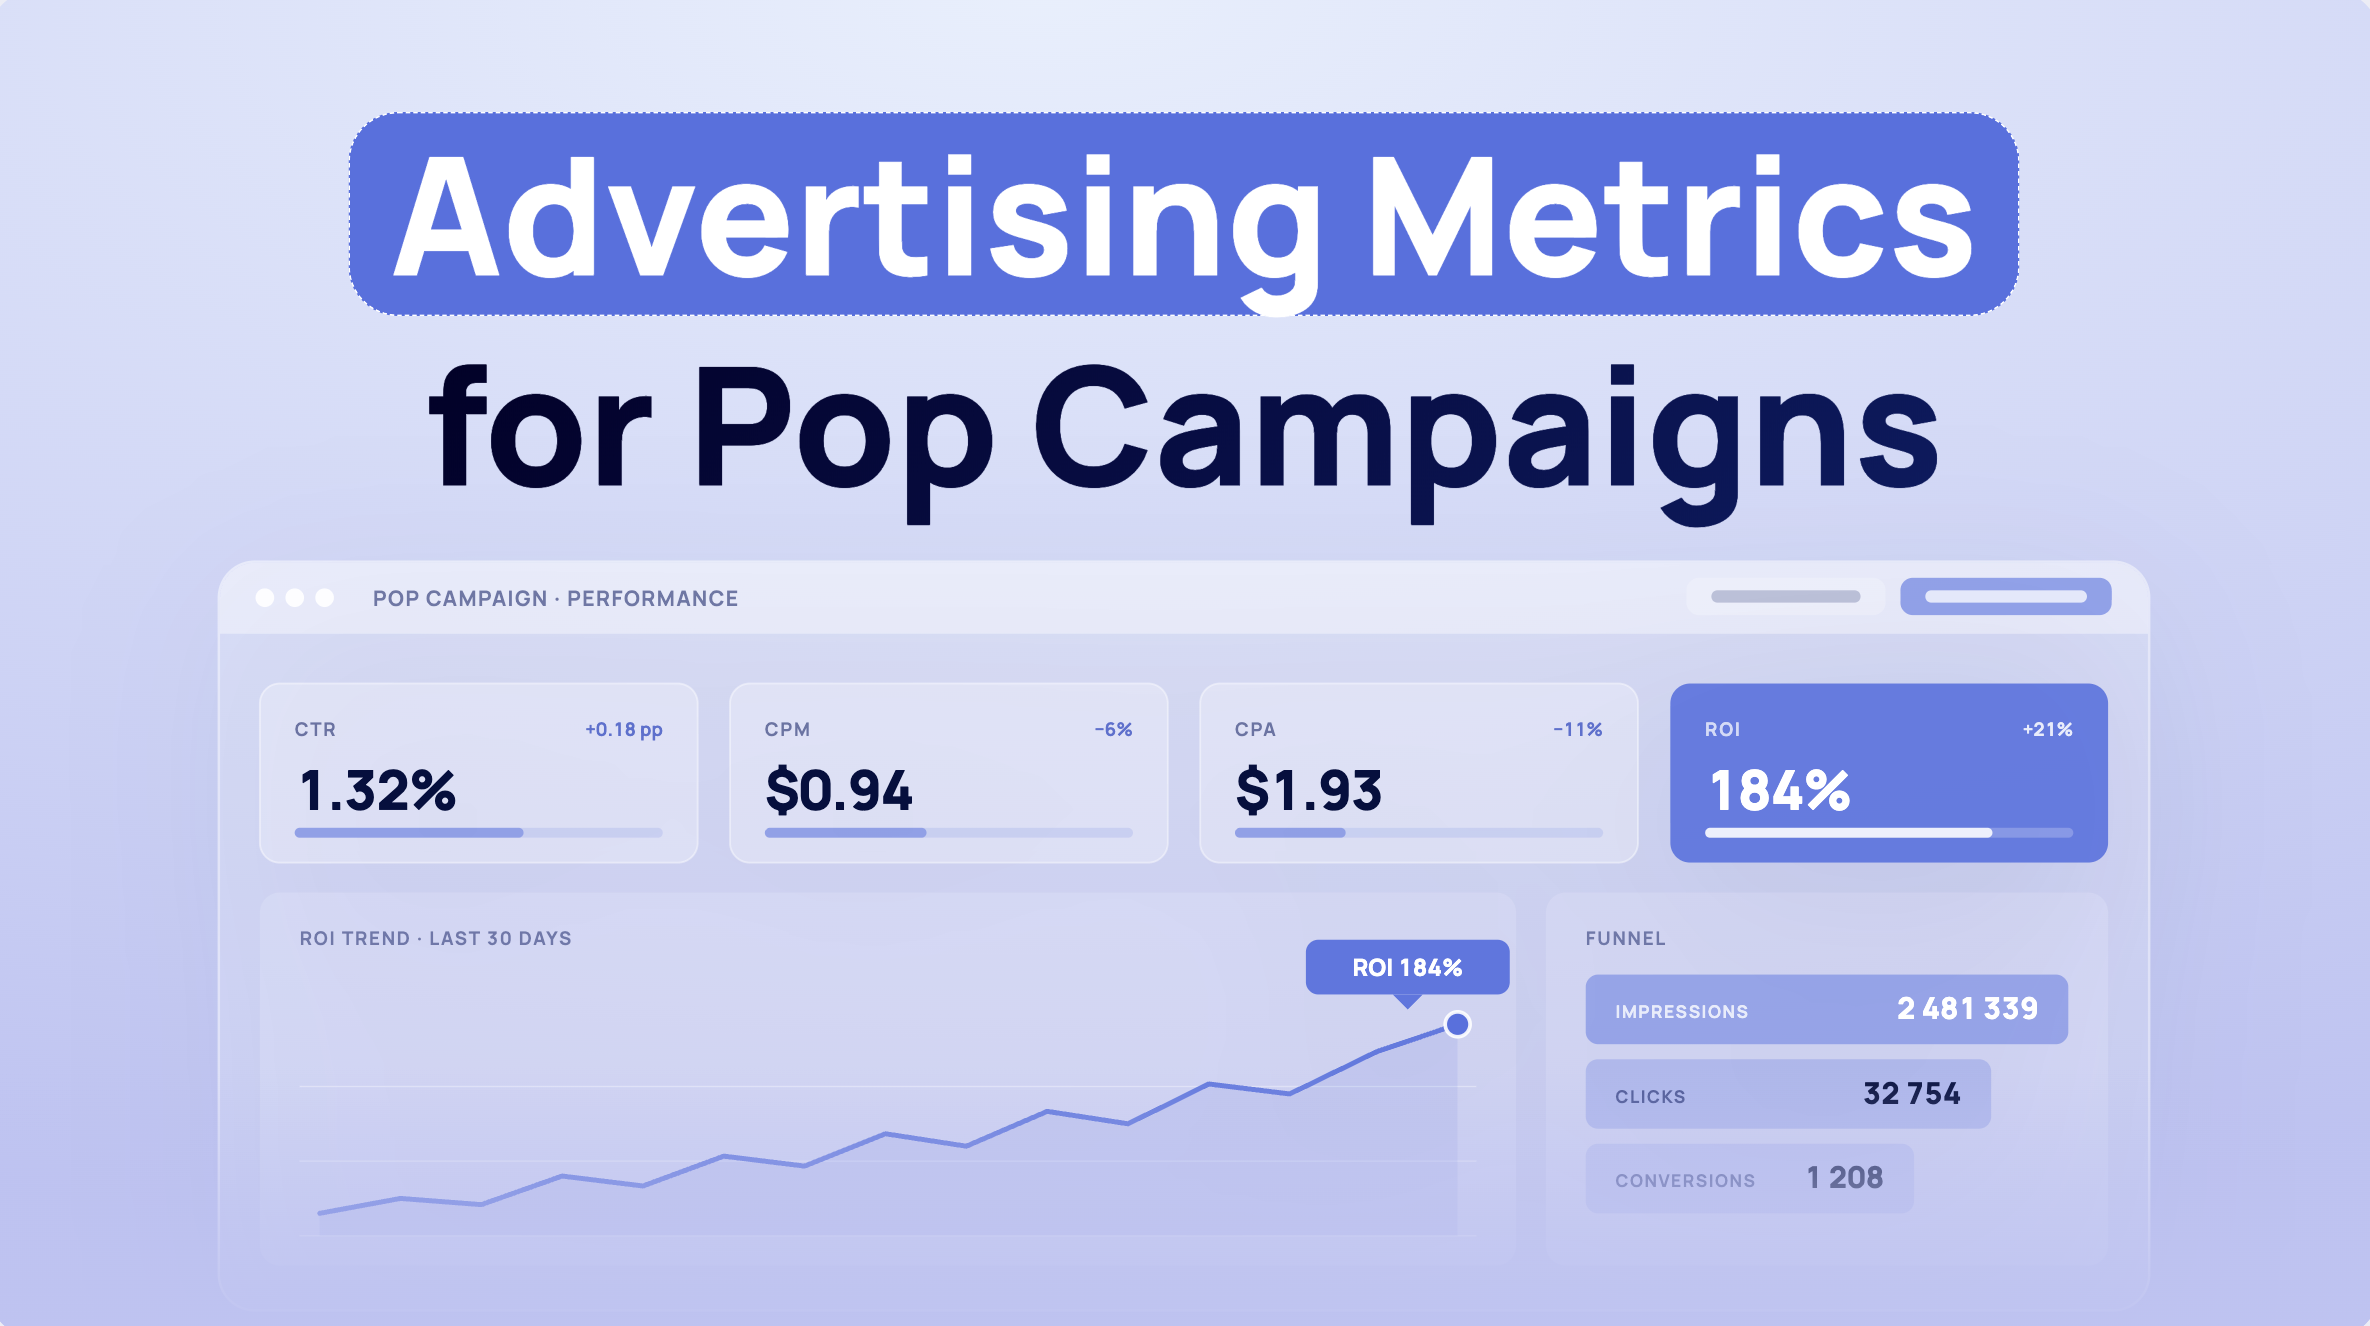
When a mobile pop campaign sits at a decent CPM but ROI keeps declining for three days, everyone starts arguing about traffic quality and nobody looks deeper. In one such case, my real problem was a prelander redirect that had died on Android. Advertising metrics for pop ad campaigns only work when they tell you where the funnel broke, not when they simply fill a dashboard.
The pop funnel and the nine metrics that drive decisions
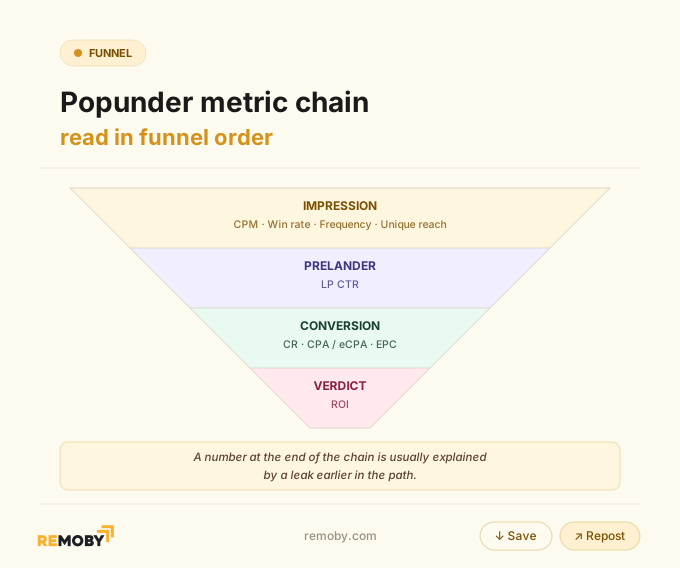
Popunder campaign metrics form one chain:
- CPM shows delivery cost
- win rate, delivered frequency, and unique reach show how that delivery happened
- LP CTR shows prelander engagement
- CR, eCPA, and EPC show conversion economics
- ROI gives the keep-or-kill verdict.
Read them in funnel order, because a number at the end is usually explained by a leak earlier in the path.
The map is straightforward:
A prelander is the intermediate page between the pop and the offer page. That page is where cold onclick traffic either gets a reason to continue or leaves.
Your scorecard should connect CPM-paid impressions to placement-level conversion outcomes, then to eCPA and ROI. A placement that looks cheap at the impression stage can still be ruinous at the conversion stage.
It’s strange that some affiliates still pull CPM and CPA into separate sheets and call it analysis. It is bookkeeping. The moment they join the two by placement (or placement depending on the naming of the traffic source), bad volume stopped looking “promising.”
The tension stays the same: did traffic fail, or did the path after the pop fail?
The next metric in the chain answers that much faster than another bid change.
In pop campaigns, CTR means LP CTR, not classic ad CTR
Landing page CTR means the share of pop impressions that click through the prelander to the offer page. A high LP CTR doesn’t prove a pop campaign will convert, because pop traffic has no conventional ad creative click and the offer page can still lose the user. Read LP CTR with CR, eCPA, EPC, and ROI before judging quality.
Pop has no conventional ad creative click. In push, native, or banner traffic, CTR is commonly read as a reaction to the creative. That intuition doesn’t transfer directly to pop.
For pop ads metrics, CTR usually means landing-page click-through rate, calculated as:
LP CTR = prelander clicks ÷ pop impressions
CR means conversion rate, and the base has to be named every time. This guide uses:
CR = conversions ÷ prelander clicks
Conversions per impression are also valid, but they’re a completely different number. Mix those bases and you’ll convince yourself a funnel changed when only the denominator changed.
LP CTR near zero is often a technical problem before it is a traffic-quality verdict. Check the tracking link, redirect chain, page load, and lander language first. I’ve blacklisted a perfectly usable placement over a dead redirect. Annoying afternoon.
For a quick format refresher, see our pop formats and Engagement Ads guide. The offer page still has to earn the click.
Where pop campaign metrics live: source dashboard vs tracker
CPA equals total spend divided by attributed conversions. ROAS equals revenue or payout divided by ad spend, while ROI equals revenue minus spend divided by spend and is the profitability verdict used here. Those are DIFFERENT metrics.
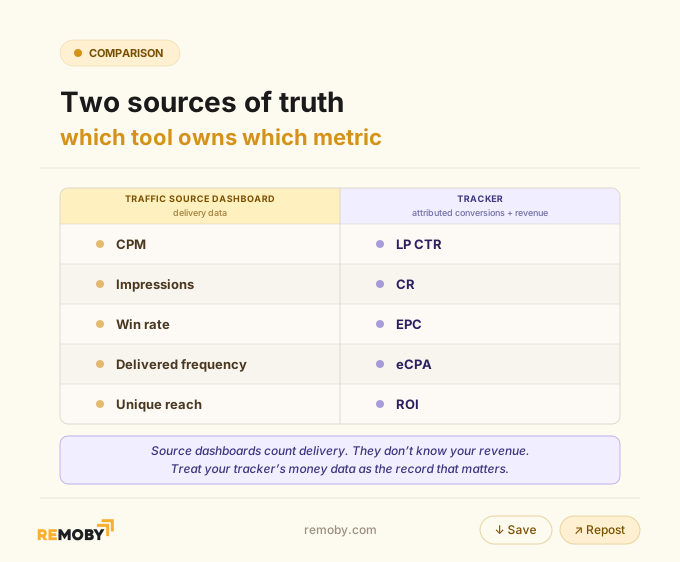
Source dashboards supply delivery data. A tracker supplies attributed conversions and revenue, making it the source of truth for eCPA, EPC, and ROI. They supply DIFFERENT data. And beginners often don’t know about it.
The traffic source dashboard owns:
- CPM
- Impressions
- Win rate
- Delivered frequency
- Unique reach
Win rate is the share of eligible auctions your bid wins. Delivered frequency is the actual average number of impressions per unique user. Unique reach means distinct users reached.
Your tracker owns:
- LP CTR
- CR
- EPC
- eCPA
- ROI
Use Voluum, Keitaro, Binom, or another tracker you trust, then treat its money data as the record that matters. Source dashboards count delivery. They don’t know your revenue.
In Tier-3, Wi-Fi versus carrier data can also be useful for separating patterns across different types of inventory.
Keep the mapping fixed across campaigns:
sub1 = placement
sub2 = campaign
Drift that structure once and cross-campaign reporting becomes useless.
Postbacks should return to the tracker and the pop network even on CPM buys. Conversion data still feeds quality signals and gives you something real to discuss with an account manager.
Read more in our affiliate tracking software cluster. No tracker number, no money decision.
Ready to launch with Remoby?
Advertising metrics table: measurement, question, and action
If you react to a metric before it has enough data behind it, you’re buying a story from noise. Keep these nine metrics in one scorecard.
| Metric | Measurement basis | Decision question | Next action |
|---|---|---|---|
| CPM / SmartCPM | Spend ÷ impressions × 1,000 | What does volume cost? | Change bids to move win rate and volume, not assumed quality. |
| Win rate | Won auctions ÷ eligible auctions | Is my bid competitive? | Raise the bid or widen targeting for underdelivery and low win rate; question overpayment if win rate is high and ROI is poor. |
| LP CTR | Prelander clicks ÷ impressions | Does the prelander hook this GEO? | Rule out broken links, redirects, load speed, and language issues, then test the prelander. |
| CR | Conversions ÷ prelander clicks | Does the offer path finish the job? | Check offer speed, language, and form friction. |
| CPA / eCPA | Spend ÷ conversions | What does one conversion actually cost? | Compare eCPA against payout or target margin; stable eCPA above payout is structural loss. |
| EPC | Revenue ÷ prelander clicks | What is each prelander click worth? | Multiply EPC by LP CTR to translate offer value into per-impression bid math. |
| ROI | (Revenue − spend) ÷ spend | Keep, scale, or kill? | Use ROI as the final verdict after enough data. |
| Delivered frequency | Impressions ÷ unique users | Is spend reaching fresh users or repeats? | Falling CR with high frequency points to burnout. |
| Unique reach | Distinct users reached | Is fresh audience still available? | Widen targeting or reduce frequency pressure when reach flattens. |
| Verdict | Read in funnel order | Where did the economics break? | Fix the first proven leak, then reassess ROI. |
SmartCPM is an auction model where you set a maximum CPM and pay only enough to beat the next bid.
On a network like Remoby, with push and pop traffic and direct publisher relationships across Tier-2 and Tier-3 GEOs, a bid move mainly changes auction access and volume. It doesn’t magically improve a weak offer.
Read metric pairs to diagnose where a popunder campaign is losing users
LP CTR, conversion rate, and EPC diagnose the leak by locating the break between impressions, prelander clicks, and revenue.
High LP CTR with low CR points to a problem after the prelander. Low LP CTR with healthy CR can be acceptable filtering. EPC converts downstream revenue into a value per prelander click.
The action follows the pair, never one metric alone.
Unprofitable eCPA needs a sample-size check first, then a split between traffic, funnel, and payout pressure. Verify that the result has enough spend and clicks, compare eCPA with the target, inspect LP CTR and CR, and check approved revenue.
A reversible bid adjustment needs less proof than a pause, while a pause removes future learning.
| Pattern | Likely bottleneck | Next check | Concrete action |
|---|---|---|---|
| High LP CTR + low CR | Prelander overpromises, or offer page fails | Offer speed, language, form length | Align the prelander promise or test the offer path. |
| Low LP CTR + healthy CR | Hard but honest prelander filtering | eCPA and ROI | Keep testing if economics hold; don’t “fix” LP CTR alone. |
| Healthy eCPA + negative ROI | Payout-side pressure | Holds, rejects, shaved payouts | Reconcile approved revenue with the CPA affiliate networks workflow. |
| Stable CPM + falling reach + rising frequency | Audience burnout | CR trend by exposure | Reduce repeat pressure and review the frequency capping guide. |
| Verdict | Find the first broken stage | Verify the adjacent metric | Change the funnel or payout issue actually causing the loss. |
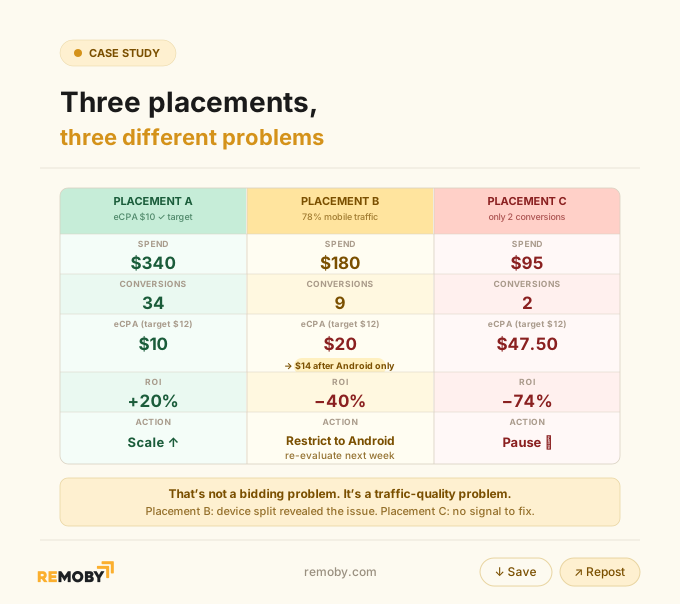
Here’s a practical example from a Tier-2 LATAM iGaming registration offer with a $12 target eCPA over seven days.
Placement A spent $340, produced 34 conversions at $10 eCPA, and returned +20% ROI. Placement B spent $180 for nine conversions at $20 eCPA and −40% ROI. Placement C spent $95 for two conversions at $47.50 eCPA and −74% ROI.
Placement B was 78% mobile, and restricting it to Android brought eCPA to $14 the next week. Placement C was paused.
That’s not a bidding problem. It’s a traffic-quality problem.
Metrics feed the placement workflow, including whitelist and blacklist decisions, but that process deserves its own zone optimization guide.
One good day is not a signal. A bad Tuesday is a bad Tuesday.
Get enough data before you scale, optimize, or kill
A meaningful test on a new GEO-plus-offer combination usually needs $1,000–2,000 in spend before a final campaign verdict as an industry benchmark.
Placement-level moves can happen sooner, with different confidence thresholds:
- 100 LP clicks and spend at twice target eCPA before a hard decision
- 50 clicks across two days for a reversible bid adjustment
- Three conversions at or under target across three days before scaling
Don’t scale, optimize, or kill on thin data. The expensive mistake is calling a placement dead after one dry day, then watching the same inventory work for someone patient enough to collect a real sample.
Use frequency and unique reach to spot audience burnout
Frequency tells you whether the campaign is paying for repeats.
High delivered frequency alongside falling CR means users are seeing the pop again and converting less. Frequency far below your cap means the cap isn’t the constraint. Flattening unique reach means the pool is running out of fresh users.
Tighter capping often improves eCPA because second and third impressions can convert worse than the first. It also cuts volume.
Push the cap too high and you can exhaust the unique-user pool while continuing to buy repeat exposure.
Start points and weekly test logic belong in the pop budget allocation article and the frequency guide, because cap setting is its own fight. And yes, it needs manual checks.
The dashboard can show stable CPM while the audience quietly disappears. If you only watch cost, you’ll blame the source after the damage is done.
Compare against your own history, not universal benchmarks
Universal LP CTR, CR, win rate, CPA, and ROI benchmarks don’t exist for popunder traffic in a form that can be applied blindly across campaigns.
Compare performance within the same:
- GEO
- Vertical
- Offer
- Device
- Measurement basis
- Historical campaign context
Metrics guide decisions; they don’t guarantee profit, because the same number can come from very different inventory, funnels, and payout rules.
The expert range for LP CTR, registration CR, or anything else is tempting. Ignore it as a verdict.
Definitions of impressions differ, devices behave differently, and a finance offer has no business being judged against a giveaway funnel. Your own history on the same offer and GEO is the comparison worth keeping.
Ready to launch with Remoby?
FAQ for Popunder campaign metrics
Five marketing metrics often means reach, engagement, conversion rate, cost per acquisition, and ROI. Pop campaigns need a wider nine-metric framework because delivery mechanics matter: CPM, win rate, delivered frequency, and unique reach explain the volume behind the money metrics. A five-number dashboard is fine for reporting. It's thin for diagnosing a broken placement.
The 70:20:10 rule is a budget-allocation heuristic: 70% toward proven activity, 20% toward adjacent tests, and 10% toward experiments. It doesn't replace campaign-specific measurement. A pop campaign with weak ROI doesn't earn 70% because a framework says so; it earns budget when its data holds.
Five key points in advertising are audience, offer, message or user experience, measurement, and profitability. In pop campaigns, the prelander carries much of the experience because there is no conventional creative click. Then the numbers decide whether the GEO, funnel bundle, and traffic source deserve another day of spend. The campaign that looked broken at the start wasn't a bad GEO. It was one dead Android redirect, then a tired user pool behind it. Read the chain in order, fix the proven leak, and ROI stops being a surprise at the end of the day.