Updated: June 8, 2026
|
13 min read
Updated: June 8, 2026
|
13 min read
How to Calculate Campaign ROI: Formula, Costs, Attribution, and Worked Examples
A campaign can show a clean 4x ROAS and still lose money once the agency cut, design hours, discounting, and tool bill land in the spreadsheet. That’s why how to calculate campaign ROI matters more than most reporting decks admit:
and the hard part is choosing the right revenue and the real denominator.
Campaign ROI Formula
Negative ROI usually starts before the math. It starts when buyers count media spend, ignore the rest of the funnel costs, and call the result “profit.”
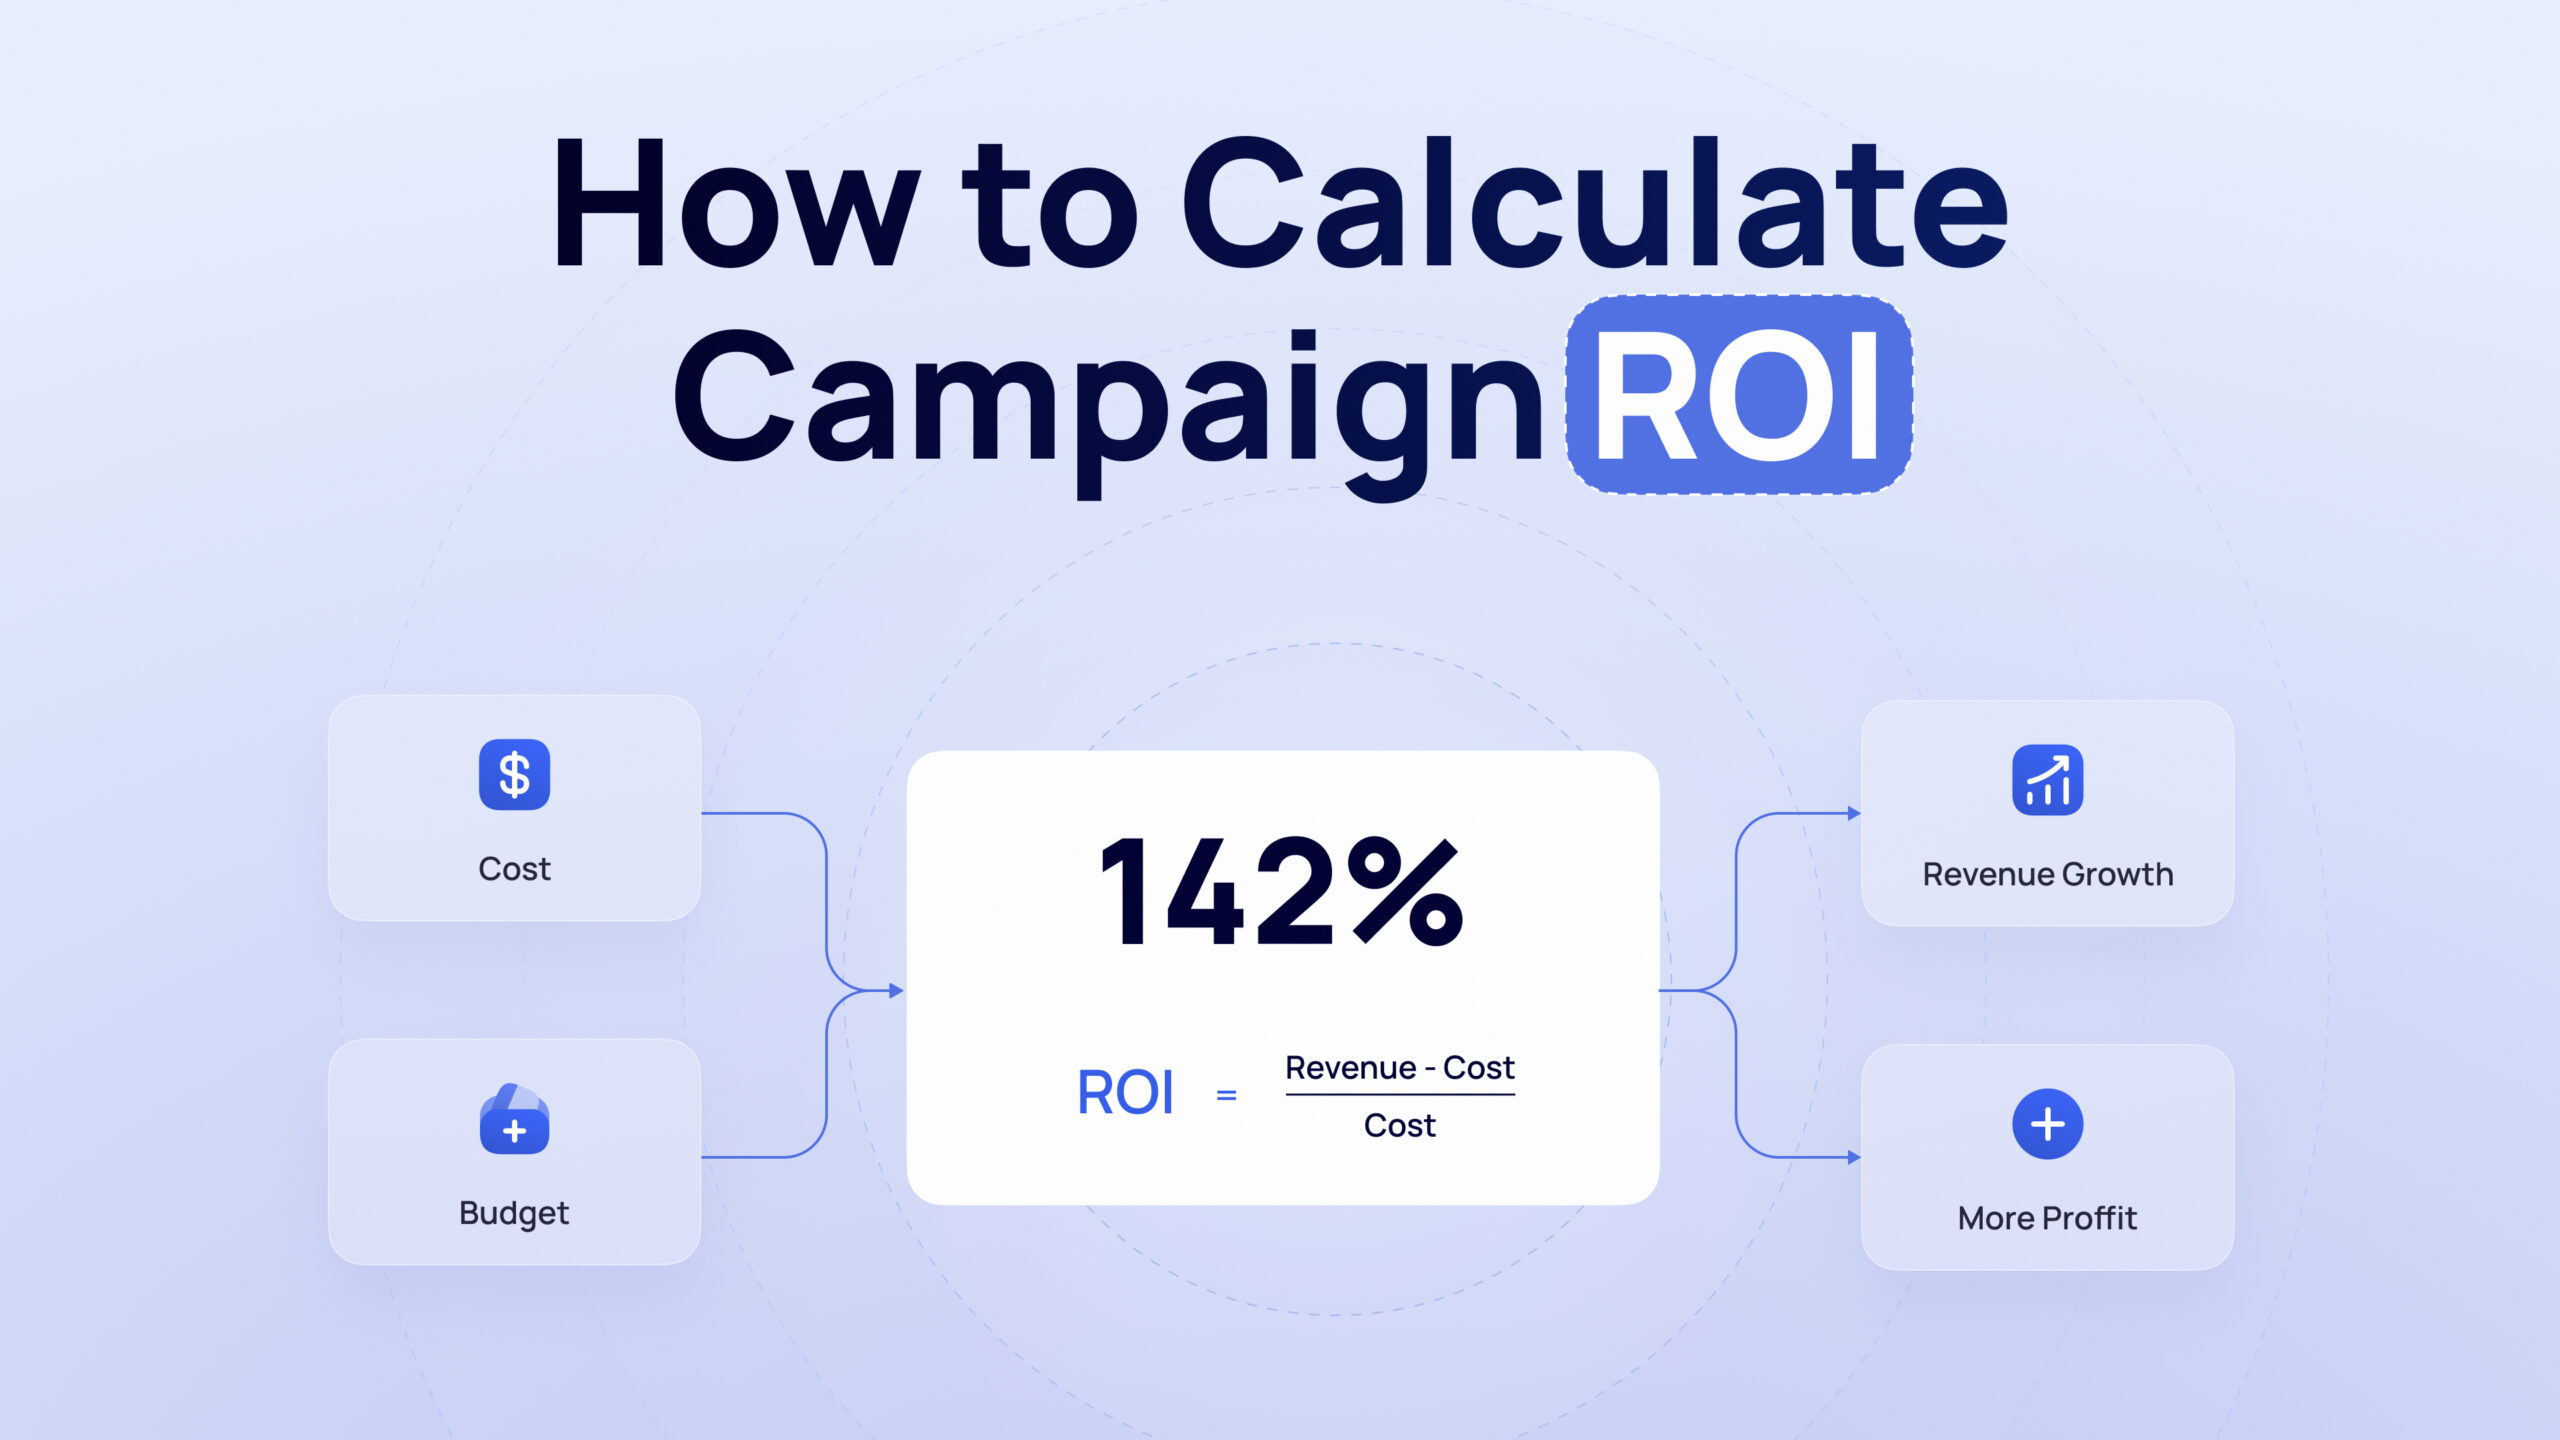
Formula: (Attributed revenue – total campaign costs) / total campaign costs x 100
Use this formula to calculate campaign ROI:
Campaign ROI (%) = ((Attributed revenue – total campaign costs) / total campaign costs) x 100
If a campaign drove $50,000 in attributed revenue and total campaign costs were $40,000, ROI is 25%. That means every $1 invested returned the original dollar plus $0.25 in profit. Not amazing, not terrible — but at least it’s honest.
What attributed revenue and total campaign costs mean
Most people assume revenue is the easy part. It isn’t, because the number changes fast once you switch from gross sales to attributed revenue or contribution margin.
Attributed revenue is the revenue you can reasonably tie to the campaign based on the attribution model and window you chose. Total campaign costs are the fully loaded costs tied to running that campaign: media, fees, creative, tools, and any other line item that would change your scaling decision if removed. That last part matters a lot. As one practitioner put it,
“If removing the cost would materially change the scaling decision, it belongs in the denominator.”
What Numbers You Need Before You Calculate Campaign ROI
Campaign ROI calculation needs four minimum inputs: spend, conversions, average order value, and a defined timeframe. Revenue is estimated by multiplying conversions by average order value, then comparing that figure against total campaign cost for the same period. Example: $5,000 spend, 120 conversions, and $60 AOV gives $7,200 revenue; ROI is (($7,200 – $5,000) / $5,000) x 100 = 44%.
Minimum inputs: spend, conversions, average order value, and timeframe
4 inputs are enough to get a first-pass answer. They are spend, conversions, AOV, and timeframe — and if the timeframe is sloppy, the whole result is sloppy too.
If you pull spend from Meta Ads, conversions from Shopify, and revenue from a wider date range, the number breaks immediately. Same window, same campaign, same attribution rules. This is where a lot of ROI reporting dies quietly.
How to estimate revenue when you only have ad spend, conversions, and AOV
If you only have partial data, do it in this order:
- Pull total ad spend for the campaign over one fixed period.
- Pull total conversions from the same period.
- Multiply conversions by average order value to estimate revenue.
- Add any missing campaign costs outside media spend.
- Run the ROI formula and label it as estimated if attribution is incomplete.
That gives you a usable first cut.
This is common in affiliate and ecommerce traffic when the postback is delayed or the CRM is a mess (I’ve had both in the same week). If conversions are 300, AOV is $45, and spend is $9,000, estimated revenue is $13,500. With no extra costs, ROI is 50%. Add $1,500 in creative and freelancer costs, and ROI drops to 28.6%. Same campaign, different truth.

Which Costs to Include in Campaign ROI
Indirect campaign ROI costs usually include prorated labor, creative production, landing page build, attribution software, data tools, and discounts used to convert the user. Marketers forget these because the invoices sit outside the ad account. Example: a campaign with $20,000 media spend, $2,500 creative cost, and $1,000 tool allocation does not have a $20,000 denominator; it has a $23,500 denominator.
Always-include costs: media, platform fees, creative, agency, discounts, and tools
The bottom line is easy here: if the campaign could not run without the cost, include it.
Always include ad spend, platform fees, and performance-based agency commissions from tools like Google Ads, Meta Ads, and TikTok Ads. Include creative production when it was built for that funnel, dedicated landing page or prelander work, discounts used to generate the sale, and dedicated software costs. If you used Voluum, Binom, or Triple Whale specifically for that campaign, it belongs in the denominator.
Conditionally allocated costs: prorated labor, overhead, data, and attribution software
What most teams miss is the gray-zone spend. That’s where ROI gets inflated.
Labor should be allocated when it is measurable and material. A full-time media buyer on one account belongs in the cost base. Someone touching a campaign for 20% of the week should only be added if that 20% is consistent and tracked. Attribution tool costs from Rockerbox, Northbeam, or Triple Whale should be prorated by channel spend share, not dumped evenly across the account (this is where most teams stop checking). General overhead is usually excluded unless finance already has a clean allocation model.
Comparison table: campaign ROI cost-inclusion checklist
| Cost item | Include? | Notes |
|---|---|---|
| Ad spend | Always | Core media cost forming the base of CAC |
| Platform fees | Always | Includes payment processing, network fees, or managed service margins tied to spend |
| Agency or freelancer fee | Always | Combine fixed retainers and performance-based compensation |
| Creative production | Usually yes | Include when creatives are campaign-specific or frequently refreshed |
| Landing page or prelander build | Usually yes | Count if developed specifically for acquisition funnel |
| Discounts or promo codes | Always | Directly reduces realized revenue, impacts true CAC:LTV |
| Tracking or attribution tool | Include if material | Allocate proportionally based on usage or spend share |
| Dedicated labor | Include if measurable | Assign full cost for roles directly tied to campaign execution |
| Partial team time | Maybe | Include only if time tracking is reliable and impact is non-trivial |
| General company overhead | Usually no | Only include with a consistent and defensible allocation model |
| Verdict | Use fully loaded costs for strategic decisions (scaling, profitability) | Use media-only view for tactical optimization, not final ROI evaluation |
Which Revenue Number to Use in Campaign ROI
Revenue choice decides whether the report is useful or fantasy. Gross revenue is fine for early creative tests, attributed revenue is better for channel reporting, and contribution margin is the defensible choice for budget allocation across offers, GEOs, or product mixes. Example: two campaigns can both show 4x ROAS, but the one selling 60% margin products has a far better true ROI than the one pushing 20% margin SKUs.
When gross revenue is acceptable and when it overstates ROI
Early testing is where gross revenue still has a place. If you’re comparing two prelanders, two audiences, or two whitelist segments inside the same offer, gross revenue is often enough for a fast read.
But once you compare different products, bundles, or channels, gross revenue starts lying. I’ve seen buyers kill a “low-ROAS” campaign that was driving high-margin packages while scaling the prettier dashboard result on low-margin SKUs. The spreadsheet looked great. The profit didn’t.
When to use attributed revenue
If you’re reporting campaign performance to a team, attributed revenue is usually the cleanest starting point.
Use attributed revenue when the goal is channel or campaign comparison and you already have a stated model: last-click, multi-touch, or lead-source. HubSpot, Oracle, and other platforms all support some version of this workflow, but the point is not the tool. The point is documenting the rules so nobody compares last-click search revenue against multi-touch paid social revenue and calls it one leaderboard.
When contribution margin is the better input for defensible ROI
The better number for scaling decisions is contribution margin, not top-line revenue.
Switch to contribution margin the moment budget allocation spans categories, channels, or GEOs. Tie margin to the actual conversion mix in the window, not blended account-average COGS. That mistake is common and expensive. In practice, this is margin-based bidding: you stop rewarding cheap conversions that don’t leave enough money after product costs.
Ready to get positive ROI with Remoby?
Choose Your Attribution Model and Window
Attribution window length should match the sales cycle and buying behavior of the campaign. Low-consideration ecommerce often starts with 7-day click and 1-day view, while B2B or high-consideration campaigns usually need 30-90 day click windows. Example: if more than 60% of purchases happen in the same session, a 1-day click window is often tighter and more honest than a 7-day view-heavy setup.
Match attribution model to campaign type: last-click, multi-touch, and lead-source approaches
If you force one model onto every campaign, ROI reporting gets distorted fast.
Last-click works for direct response funnels with short paths and clear user action. Multi-touch is better when paid social warms the user and search closes. Lead-source models fit CRM-heavy flows where Salesforce or HubSpot tracks the contact, then revenue closes later. For push or pop traffic from networks like Remoby (pop network with direct publisher relationships in Tier-2 and Tier-3 GEOs), last-click often stays cleanest when the funnel is short and the postback is reliable.
How to choose an attribution window by sales cycle, channel, and buying behavior
Start with the buying cycle, not the platform default.
For low-consideration ecommerce, start with 7-day click/1-day view. If same-session purchase rate is above 60%, tighten to 1-day click. For B2B lead gen or high-consideration sales, use 30-90 day click windows and reconcile with CRM outcomes at 60-90 days. View-through is the usual culprit when ROI looks suspiciously clean. Holdout tests often cut attributed ROI by 20-40% (representative practitioner example).
Step-by-Step Campaign ROI Calculation Process
The fastest way to mess this up is to mix reporting periods and then optimize off noise. Use one repeatable workflow.
Step 1: Gather campaign costs and normalize the timeframe
- Export spend for the exact campaign period.
- Add non-media costs tied to that same period.
- Remove costs outside the campaign window.
- Put all numbers into one reporting sheet.
Keep the window consistent.
Step 2: Choose revenue input and attribution assumptions
- Pick gross revenue, attributed revenue, or contribution margin.
- Choose the attribution model.
- Set the attribution window.
- Write those assumptions beside the calculation.
Undocumented assumptions become fights later.
Step 3: Apply the campaign ROI formula and express the result as a percentage
- Subtract total campaign costs from chosen revenue.
- Divide the result by total campaign costs.
- Multiply by 100.
- Report the percentage and the raw dollar profit or loss.
Step 4: Sanity-check the result before making decisions
- Compare ROI against ROAS and break-even ROAS.
- Check if view-through credit inflated revenue.
- Review product mix and margin assumptions.
- Confirm the postback or CRM mapping is correct.
Worked Example: eCommerce Campaign ROI Calculation
A clean worked example beats five theory paragraphs every time.
Full cost build, attribution window, attributed revenue, and final ROI
A B2C subscription campaign running across Meta Ads and Google Ads spent $180,000. Agency fee was $18,000. Creative production added $12,000. Prorated attribution tool cost added $2,400. Total campaign cost: $212,400.
The campaign acquired 1,840 new subscribers. Average first-order value was $65, but using gross revenue here would flatter the result. The more defensible input was 90-day contribution margin. Using a 68% gross margin and a 1.4 average repeat rate at 90 days, 90-day contribution margin per subscriber came to $103. Total 90-day contribution margin: $189,520.
ROI = (($189,520 – $212,400) / $212,400) x 100 = -10.8%.
That looks bad at first glance. The decision was not to kill the campaign, though. Prior cohorts showed a 14-month payback window, so the team held budget flat, shifted creative toward higher-LTV segments, and reviewed again at month 6 (representative practitioner example).
Worked Example: Lead-Gen Campaign ROI for a Long Sales Cycle
Pipeline campaigns usually look worse early than they really are. That’s normal.
Pipeline-based revenue assumption, longer attribution window, and final ROI
A B2B SaaS search and paid social campaign spent $40,000 over 30 days. Add $4,000 creative and landing page work, plus $3,000 for CRM ops and reporting support, and total cost reaches $47,000.
The campaign drove 220 leads at a CPL of about $182. Early SQL rate held steady, so the team didn’t force month-one ROI. Instead, they measured pipeline at 90 days. Using the practitioner benchmark of $4-6 pipeline per $1 spend for healthy B2B SaaS at 90 days, this campaign produced $235,000 pipeline value, or 5x spend (representative practitioner example).
If only 25% of that pipeline closes and margin assumptions hold, recognized revenue is still enough to justify optimization rather than a pause. Short version: in long-cycle funnels, early negative ROI is often a reporting artifact, not a verdict.
Campaign ROI vs ROAS
ROAS is for media efficiency. ROI is for profitability. Confusing them is how teams scale losers.
Comparison table: campaign ROI vs ROAS by formula, inputs, and use case
| Metric | Formula | Costs included | Best use | Weak spot |
|---|---|---|---|---|
| ROAS | Revenue / ad spend | Media spend only | In-platform optimization, creative testing, bid and placement decisions | Ignores non-media costs (agency, tools, labor, discounts), can overstate efficiency |
| Campaign ROI | (Revenue – total campaign costs) / total campaign costs × 100 | Fully loaded costs (media + fees + production + tools + labor) | Strategic evaluation, budget allocation, profitability and scaling decisions | Slower to compute, sensitive to attribution accuracy and cost allocation methods |
Use ROAS for tactical buying decisions; use ROI to assess true business profitability
How to Interpret Campaign ROI for Scale, Pause, or Optimize Decisions
Negative campaign ROI means the campaign returned less revenue than total cost in the measured window, but the action is not always “turn it off.” Early-stage tests, long payback models, and delayed conversion cycles can justify holding or optimizing instead of pausing. Example: a -10.8% 90-day ROI in subscription ecommerce can still be acceptable if prior cohorts recover acquisition cost within 14 months.
What positive, borderline, and negative ROI can mean in practice
A positive number is not always scale-ready. A negative number is not always dead.
Use positive ROI to ask whether the margin profile supports more spend without wrecking efficiency. Treat borderline ROI as an optimization zone: fix funnel leaks, bad zones, weak creatives, or weak product mix. Treat negative ROI as a pause if the payback window is short and the loss persists for two review cycles. In direct response, one expert threshold was to pause below 1.8x CM-ROAS for two consecutive weeks and scale above 2.5x (representative practitioner example).
Why decision thresholds depend on margin, payback period, and business model
There is no universal cutoff. Anyone selling one probably wants to sell you a dashboard too.
A finance offer, subscription funnel, iGaming product, and B2B SaaS pipeline all recover spend on different clocks. Paid social also burns faster than search because creative fatigue compresses the review window. Weekly checks make more sense there. Search often works on bi-weekly review unless spend velocity is high.
Common Mistakes That Distort Campaign ROI
Long sales cycles, delayed conversion capture, and mismatched time horizons
If spend is measured over 30 days and revenue is credited over 7, the campaign will look broken. If spend is measured over 30 and revenue is credited over 180, the campaign will look blessed.
Match the time horizon to the buying cycle. For long-cycle campaigns, report a short-term efficiency metric and a later ROI reconciliation. Otherwise you’ll blacklist decent traffic sources, cut campaigns too early, and wonder why the funnel never stabilizes.
View-through attribution, incrementality, and when LTV can mislead ROI reporting
What most people trust too much is view-through revenue and full LTV. View-through often overstates lift, especially in broad targeting. Incrementality tests commonly reduce reported ROI by 20-40% (representative practitioner example). And full post-purchase LTV should not be shoved into the numerator unless cohort data already proves it. A 90-day contribution margin figure is usually more defensible than lifetime fantasy math (yes, that report has burned me too).
What Counts as a Good Campaign ROI
A “good” ROI depends on margin structure, payback window, and how much risk the business can hold. Generic benchmarks like 5:1 being strong and 10:1 being exceptional appear in secondary sources (industry benchmark), but they are too broad for day-to-day media buying.
Why benchmarks vary by margin structure, channel, and objective
The same ROI can mean “scale” in one account and “cut it” in another.
If the campaign sells high-margin subscriptions, borderline ROI is often workable. If it pushes low-margin SKUs with no backend revenue, even a decent top-line number may fail. That’s why ROI vs. ROAS differences matter when you’re comparing offers, channels, or GEOs.
Ready to get positive ROI with Remoby?
FAQ: How to calculate ROI
How to calculate campaign ROI? Learn from this FAQ.
Campaign ROI uses estimated revenue when only spend, conversions, and average order value are available. Multiply conversions by average order value to get revenue, subtract total campaign cost, divide by total campaign cost, then multiply by 100. Example: $4,000 spend, 100 conversions, and $50 AOV gives $5,000 revenue and 25% ROI before adding any other campaign costs.
Gross revenue works for early campaign ROI checks when you are comparing creative tests or audiences inside the same product line and margin profile. Gross revenue overstates ROI when campaigns drive different SKUs, channels, or discount levels. For budget allocation, attributed revenue or contribution margin is a more defensible numerator.
Indirect costs commonly missed in campaign ROI are prorated labor, creative production, landing page build, attribution software, reporting tools, and discounts used to convert the sale. Those costs sit outside the ad account, so teams skip them and inflate ROI. If removing a cost would change the scale-or-pause decision, that cost belongs in the denominator.
Attribution window length should match the campaign's sales cycle and buying behavior. Low-consideration ecommerce often starts with 7-day click and 1-day view, or even 1-day click if most purchases happen in the same session. B2B and high-consideration campaigns usually need 30-90 day click windows, then CRM reconciliation to avoid short-window underreporting.
Negative campaign ROI means the measured revenue was lower than total campaign cost in the chosen window, but the decision depends on payback timing and campaign stage. Early tests and long-cycle funnels can justify optimization or holding spend. Persistent negative ROI in short-cycle offers usually means pause, cut bad zones, or fix the funnel before spending more.
Contribution margin is the strongest revenue input for campaign ROI when the number will drive budget allocation across products, channels, or GEOs. Attributed revenue is a good middle ground for channel reporting. Gross revenue is acceptable only for early tests inside the same product line, because it ignores margin differences and often overstates profitability.