Updated: June 4, 2026
|
9 min read
Updated: June 4, 2026
|
9 min read
Affiliate Marketing Statistics 2026: Key Benchmarks vs 2025
The number that gets quoted in the deck is usually the least useful one in the operating model. Affiliate marketing statistics for 2026 look bigger than 2025 almost everywhere — but some of those numbers are commissions, some are platform revenue, and some are forecasts pretending to be observations.
Top affiliate marketing statistics for 2026
Affiliate marketing statistics 2026 show a market still growing, but not evenly across models. US affiliate spend is projected at $13.20 billion in 2026 vs. $11.99 billion in 2025 according to eMarketer affiliate marketing charts. Global affiliate industry value is still commonly cited at $18.5 billion from Cognitive Market Research data, while the broader affiliate platform market is estimated at $23.8 billion in 2026 by Grand View Research. Those figures are not interchangeable.
- US affiliate spend: $13.20B in 2026 vs. $11.99B in 2025, both forecast figures (from eMarketer)
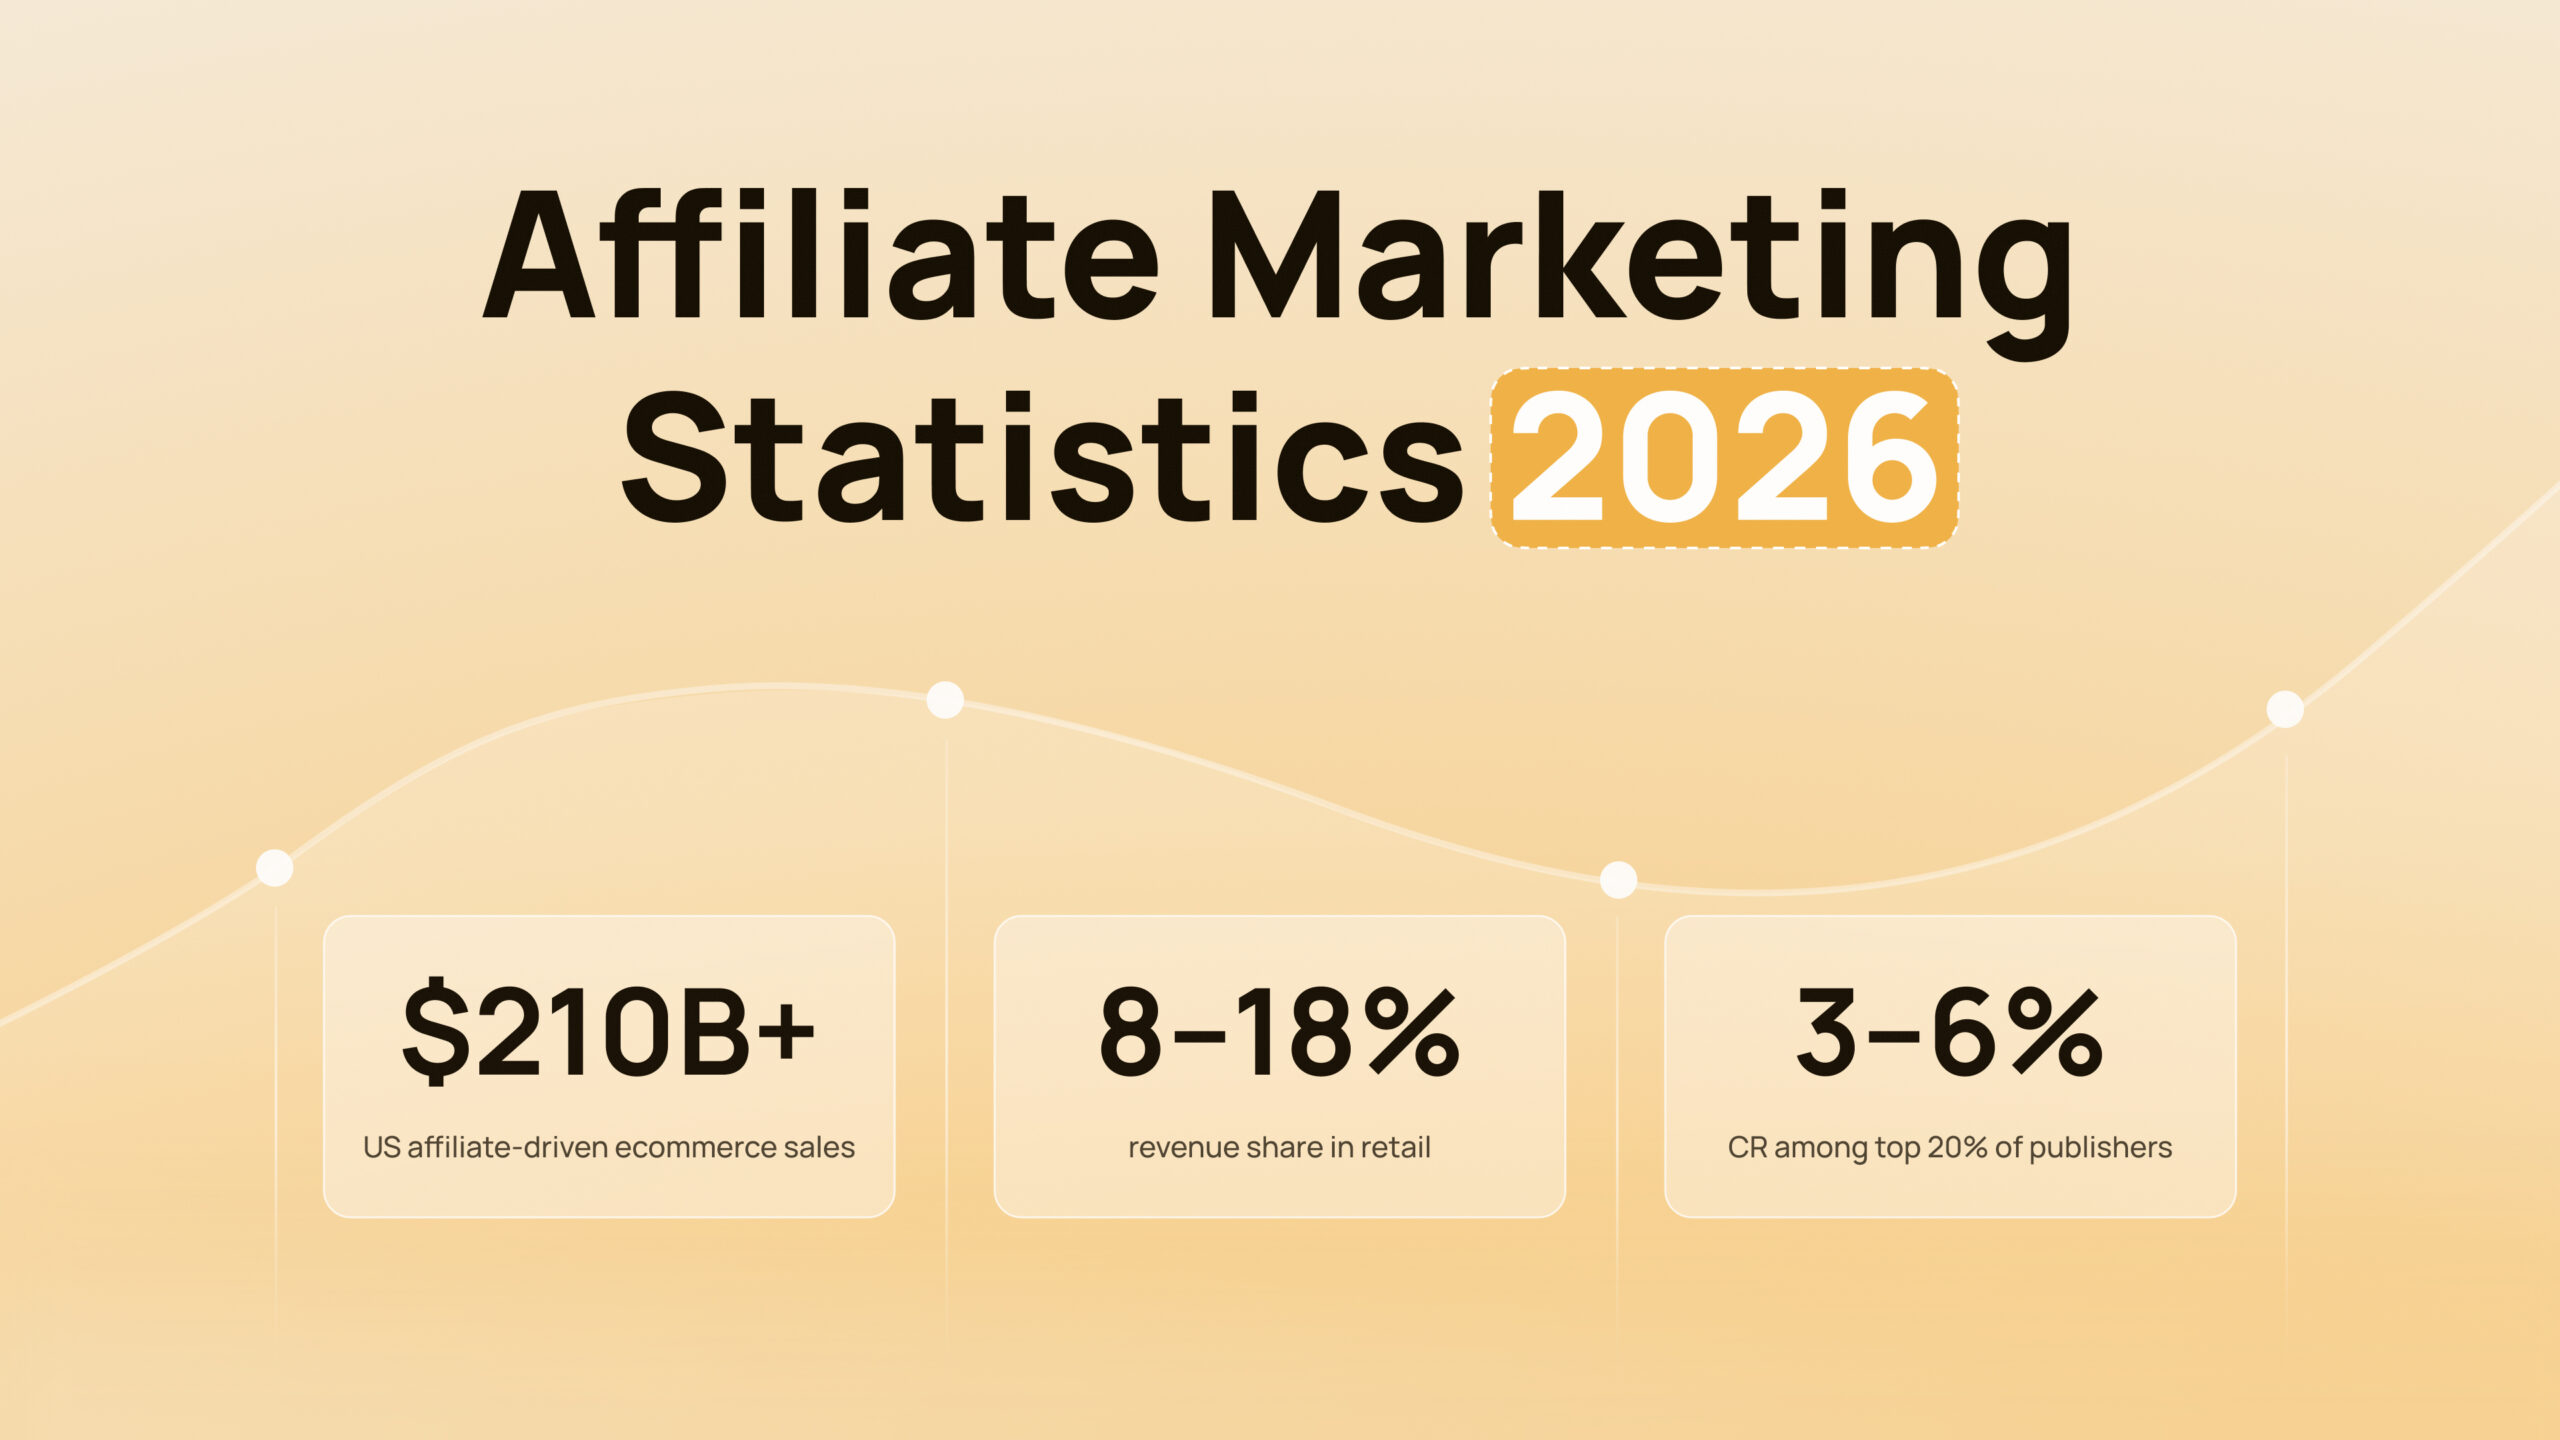
- US affiliate-driven ecommerce sales: $113B in 2024, or 9.4% of US ecommerce (Fintel Connect affiliate marketing statistics)
- Traffic-source usage: SEO 69%, social 67%, content 65%, email 42%, PPC 34% (AffiliateWP benchmark cited across industry roundups)
- Consumer purchase behavior: 57% bought via cashback/reward affiliates; 41% via coupon affiliates (Fintel Connect)
- ROI reality check: fully loaded affiliate ROI above 4x is competitive; above 8x is top quartile in performance verticals
The spend line is rising. The more important variable is where the revenue share is moving underneath it.
Plain-English summary of the most decision-relevant affiliate marketing stats for 2026
Most teams see growth and assume channel health. The reality is narrower: spend is up, content-led discovery is down, and publishers closer to conversion are taking a bigger share of the same funnel.
If you run affiliate as a pure content channel, 2026 is worse than 2025. If your mix includes coupon, cashback, creator traffic, email, or branded search, the year looks more stable. In operator data shared for this article, content publisher organic traffic share fell 15% to 25% YoY, while influencer-driven revenue contribution rose 30% to 50% in iGaming, social, and blockchain verticals.
Which variable actually moves the margin? Is the EPC falling because the funnel got weaker, or because discovery traffic got taken by AI? Are you benchmarking against spend, or against revenue contribution?
The headline number is easy to quote. The benchmark set you compare first is where bad planning usually starts.
The first metrics to compare in a 2026 affiliate benchmark deck
Start with five lines, not fifty:
- Advertiser spend by GEO and source year
- Revenue contribution as share of ecommerce or program sales
- Fully loaded ROI/ROAS including network, platform, and agency costs
- CR and AOV by publisher model
- Attribution terms: cookie window, last-click rules, scrub rate
That is the usable benchmark deck.
What gets missed is comparability. A program with 6x ROI on CPA can be weaker than a 4x one after scrub rate, delayed validation, and tech fees are added (the math changes here).
Affiliate marketing statistics 2026 vs 2025 comparison table

How to read the 2026 vs 2025 comparison: geography, source year, and forecast labels
If you mix global market size with US spend, the deck looks precise and the decision gets worse. The cleanest mistake in affiliate reporting is comparing commissions paid, platform revenue, and retailer sales contribution as if they are one KPI.
Use three labels on every row: where, when, and what exactly is being measured. Without that, your whitelist of “good numbers” is weaker than a blacklist of bad zones.
I’ve seen teams present $22.6B and $13.6B on the same slide as if they were comparable. They aren’t.
Ready to launch with Remoby?
How big is the affiliate marketing industry in 2026 compared with 2025?
Affiliate marketing industry size in 2026 depends on which market you mean. The most cited global affiliate industry figure remains $18.5 billion from Cognitive Market Research for 2024, not a verified 2026 actual. A separate affiliate platform market estimate from Grand View Research puts the category at $23.8 billion in 2026 vs. $22.6 billion in 2025. For operators, US advertiser spend from eMarketer is usually the more decision-ready benchmark.
Market size vs advertiser spend vs platform market: which number measures what
Most people assume “market size” means money paid to affiliates. Often it does not. Sometimes it means software, tracking, networks, and SaaS platforms like impact.com, Partnerize, and Tune bundled into the same figure.
That is why the numbers conflict. $18.5B is commonly used as global advertiser commission spend. $22.6B to $23.8B adds the infrastructure layer. $13.6B is US-only advertiser spend. Different numerators, different scope, different answer (operators know this — most affiliates never ask).
The market number looks settled once you label it correctly. The harder part is deciding which one belongs in a planning model.
Industry growth statistics with clear scope and forecast status
A growth rate without scope is decoration. eMarketer’s US line implies roughly 10.1% YoY growth from 2025 to 2026 on spend. Grand View Research’s platform-market line implies a slower 5.3% YoY expansion. Cognitive Market Research’s longer-range global CAGR is often cited near 8%, but that is a multi-year forecast, not a 2026 operating figure.
For budgeting, shorter-cycle advertiser spend beats long-horizon CAGR every time.
What is the latest estimate of affiliate marketing spend and revenue contribution in 2026?
Affiliate marketing statistics are most useful here when spend and revenue contribution are split cleanly. Affiliate marketing spend in 2026 is best cited as $13.20 billion in projected US advertiser spend, up from $11.99 billion in 2025, using eMarketer. Revenue contribution is measured differently: Fintel Connect reports affiliate drove $113 billion in US ecommerce sales in 2024, equal to 9.4% of total US eCommerce. One figure is spend into the channel; the other is sales credited from the channel.
US affiliate spend in 2026 vs 2025: observed data, projections, and caveats
$13.20B sounds clean. It is still a forecast. No reliable public source has verified a full-year 2026 actual yet.
That matters because buyers often build payout expectations off the projected spend line. If spend grows 10% while content traffic inventory shrinks and commissions hold flat, your effective CPA can still worsen. A network that fits CPA-first Tier-2 strategy, like Remoby with direct publisher relationships in push and pop, belongs in a different benchmark sheet than SEO-heavy affiliate programs.
Revenue contribution, ROI, and manager-ready benchmark comparisons
The ROI figure most often quoted is the one least worth trusting. Public benchmarks swing from $6.50 to $15 returned per $1 spent, but those sources rarely align on fees, vertical, or attribution. Practitioner data is more useful: 4x+ fully loaded ROI is competitive; 8x+ is top quartile in performance sectors (affiliate marketing ROI benchmarks).
Mid-sized iGaming programs often sit in the $4 to $8 range. Finance and blockchain offers are more often $3 to $6 on CPA/CPL economics. Social offers are tighter at $3 to $5 because subscription LTV has compressed.
The payout line can look stable for months. What changes faster is mix quality by publisher model.
Which affiliate marketing trends changed most from 2025 to 2026?
Affiliate marketing trends changed most in publisher mix, not in the topline spend curve. Content affiliates dependent on Google discovery lost share as AI Overviews absorbed top-funnel clicks, while influencer, coupon, cashback, and other conversion-near models held or gained. In operator data, content traffic fell 20% to 40% in affected verticals since Q2 2025, and programs concentrated in a few large content partners saw 15% to 25% revenue drops.
Which affiliate publisher models gained or lost share between 2025 and 2026?
If you were heavy on review and comparison publishers, 2026 probably hurt more than 2025. If you had creator codes, newsletters, Telegram, YouTube, or loyalty inventory in the mix, the drop was easier to absorb.
Directional winners: influencer affiliates, coupon, cashback, and direct-audience publishers. Directional losers: SEO-first content publishers chasing generic discovery queries. Coupon and cashback were often flat in absolute revenue but up in percentage share because the content denominator shrank.

Impact of AI Overviews and Google organic volatility on affiliate content publishers
69% of publishers report concern about Google and AI traffic volatility, and 52% are testing new formats, according to Fintel Connect. The practical read is harsher than the survey line: AI Overviews remove the click before the prelander ever gets a chance.
Programs built around commercial-intent queries and branded search still have room. Programs built around “best” and “top” terms are seeing the funnel thin out at the top. *Is the zone bad, or did the search result stop sending the click at all?* In this case, it is often the second one. Recent reporting on AI Overviews and lower publisher clicks supports that direction of travel.
Are affiliate marketing conversion rates improving in 2026?
Affiliate marketing statistics suggest conversion rates in 2026 are improving selectively, not broadly. Public data shows stronger purchase intent around affiliate touchpoints — for example, 57% of consumers buying via cashback/reward environments and 41% via coupon publishers (Fintel Connect) — but there is no clean, cross-industry 2025 vs. 2026 CR series. Improvement is strongest where traffic is closer to purchase, AOV is stable, and attribution rules are not inflating apparent gains.
Conversion-rate benchmarks, AOV, and shopper behavior signals
What most buyers assume is that better onsite CR means the channel improved. Often the mix improved. When content traffic drops and coupon/cashback share rises, the average CR lifts because the click comes later in the funnel.
Other consumer signals still support affiliate as a closing channel: 74% of US internet users visit multiple affiliate sites before purchasing, and 83% say coupons affect shopping behavior (industry benchmark from sources cited across competitor research). Good for conversion. Less good if you mistake closing power for incrementality.
Why do affiliate marketing statistics vary by geography and methodology?
Affiliate marketing statistics vary by geography and methodology because reports measure different layers of the same channel. Some track global commissions paid, some count US advertiser spend, some estimate the platform/software market, and others rely on publisher or consumer surveys. Add forecasted 2026 numbers next to observed 2024 or 2025 figures, and the conflict is built in before the analysis starts.
Geography, survey design, attribution windows, and forecast-vs-observed differences
Failure usually starts at attribution. A 30-day cookie window, last-click model, and low scrub rate will produce a very different revenue contribution number than a short window with stricter validation.
Then geography compounds it. North America at roughly 40% share of the global market and Asia-Pacific at roughly 23% tell you where scale sits, not what your program should earn in a given GEO (Cognitive Market Research). Compare by vertical, GEO, and deal structure — not by headline statistic.
Challenges, fraud, and AI adoption in affiliate marketing
Fraud pressure did not disappear because AI got all the attention. It only got easier to hide low-quality traffic inside broader channel volatility.
Three checks matter in 2026:
- Track scrub rate by publisher model, not only by affiliate
- Separate AI-assisted content production from AI-created demand assumptions
- Watch concentration risk when one publisher or one traffic source drives too much revenue
A rising spend line can hide weaker incrementality, softer CR, and a longer payback window. That is where operator economics usually break first.
Ready to launch with Remoby?
FAQ for Affiliate Marketing Statistics from 2025
Read top 5 affiliate marketing statistics questions
Benchmark metrics should start with advertiser spend, revenue contribution, fully loaded ROI, CR by publisher model, and attribution terms. Those five show whether the channel is actually paying back or only looking healthy in last-click reporting. Add AOV, scrub rate, and cookie window next if the program uses mixed CPA and rev share structures.
The clean answer is not that affiliate got bigger in 2026. It did. The usable answer is narrower: if your program depended on discovery-heavy content, 2025 was the warning and 2026 is the bill. If your mix sits closer to conversion, the channel still compounds.
Publisher mix adjustments should start by mapping each partner against two axes: discovery dependence and conversion proximity. Programs over-indexed on SEO-led content publishers are seeing 15% to 25% revenue drops as AI Overviews absorb top-funnel clicks, while creator, coupon, cashback, email, and Telegram-led inventory has held or gained share. Rebalance toward conversion-near publishers, but watch concentration risk — swapping one fragile dependence for another doesn't fix incrementality, it just renames it.
ROI benchmarks by vertical only mean something once fees, scrub, and validation timing are in the number. Mid-sized iGaming programs typically sit in the $4 to $8 returned per $1 spent range, finance and blockchain in $3 to $6 on CPA/CPL structures, and social or subscription offers tighter at $3 to $5 because LTV has compressed. Public figures quoting $12 to $15 per $1 are usually gross CPA returns with network fees and validation lag stripped out — useful in a pitch deck, not in a planning model.
Protecting affiliate revenue against Google volatility starts with reducing single-source traffic dependence before the next algorithm change forces it. 69% of publishers report concern about AI and Google traffic volatility and 52% are testing new formats, and the practical exposure is concentrated in "best" and "top" commercial queries where the click is often absorbed before the prelander loads. Three operator moves help: shift weight toward branded search, creator codes, email, and loyalty inventory; renegotiate deals where one publisher drives more than 30% of program revenue; and stop forecasting 2026 commissions off 2024 organic traffic curves.